I’ve been pretty quiet recently and that’s mainly due to my working with Michael Malak on Spark GraphX in Action for Manning Publications. The book takes you through all the steps you need to get started working with large-scale graphs using Apache Spark. No specific knowledge of Spark, Scala or graphs is assumed and we have you running PageRank, Label Propagation and Connected Components in no time at all. We all also show how GraphX solves real-world problems and perhaps most of important of all, that GraphX allows you to integrate graph analytics with all the other features of Spark to create complex processing pipelines all within one platform.
If that’s whetted your appetite then you can buy the book now under Manning’s Early Access Program (6 chapters are already released with more to come). Even better if you are reading this on September 8 you can get half off under a ‘Deal of the Day’ offer. Just use code dotd090815au at https://www.manning.com/books/spark-graphx-in-action.
Right now I’m writing about how Spark’s monitoring tools can help you diagnose performance problems. And it’s fair to say that a couple of enhancements to the Application UI that came with Spark 1.4 are great additions to the toolset:
- Event Timelines
- DAG Visualisation
In this post I’ll look at what Event Timelines give you and will pick up DAG Visualisation in a future post.
The Application UI is created whenever a SparkContext is created in your driver. By default it will listen on port 4040. When you click on the home page you’ll initially get to a page listing all the jobs that are or have been running in your application – here jobs means actions such as collect, reduce or saveAs…File. This much has been available for a while in Spark but with 1.4 you get a new feature to select Event Timeline. When you select this in the Jobs page a visualisation is revealed that shows a timeline of Executors and Jobs. The Executors view shows when Executors have been added or removed – a quick way to see whether any performance issues you have are related to execution nodes failing.
The Jobs timeline shows when each job has been run and allows you to click through to a job detail page that shows the stages that were executed to complete the job. The figure below shows the stages arising from running the following code that loads a list of academic paper citations, joins it to a file of paper names and outputs the title of the paper with the most citations.
val papers = sc.textFile("Cit-HepTh.txt")

.filter(!_.startsWith("#"))

.map(_.split("\t")(1))

val citation_count = papers.map((_,1))

.reduceByKey(_+_)

val titles = sc.textFile("abs1992.txt")

.map(_.split("\t"))

.filter(_.size > 1)

.map(ary => (ary(0),ary(1)))

citation_count.join(titles)

.reduce( (a,b) => if (a._2._1 > b._2._1) a else b)
If we view the results of this code in the Stages event timeline we can see that this has generated 3 stages, 2 of which run in parallel and the third that only starts when the first 2 have completed.
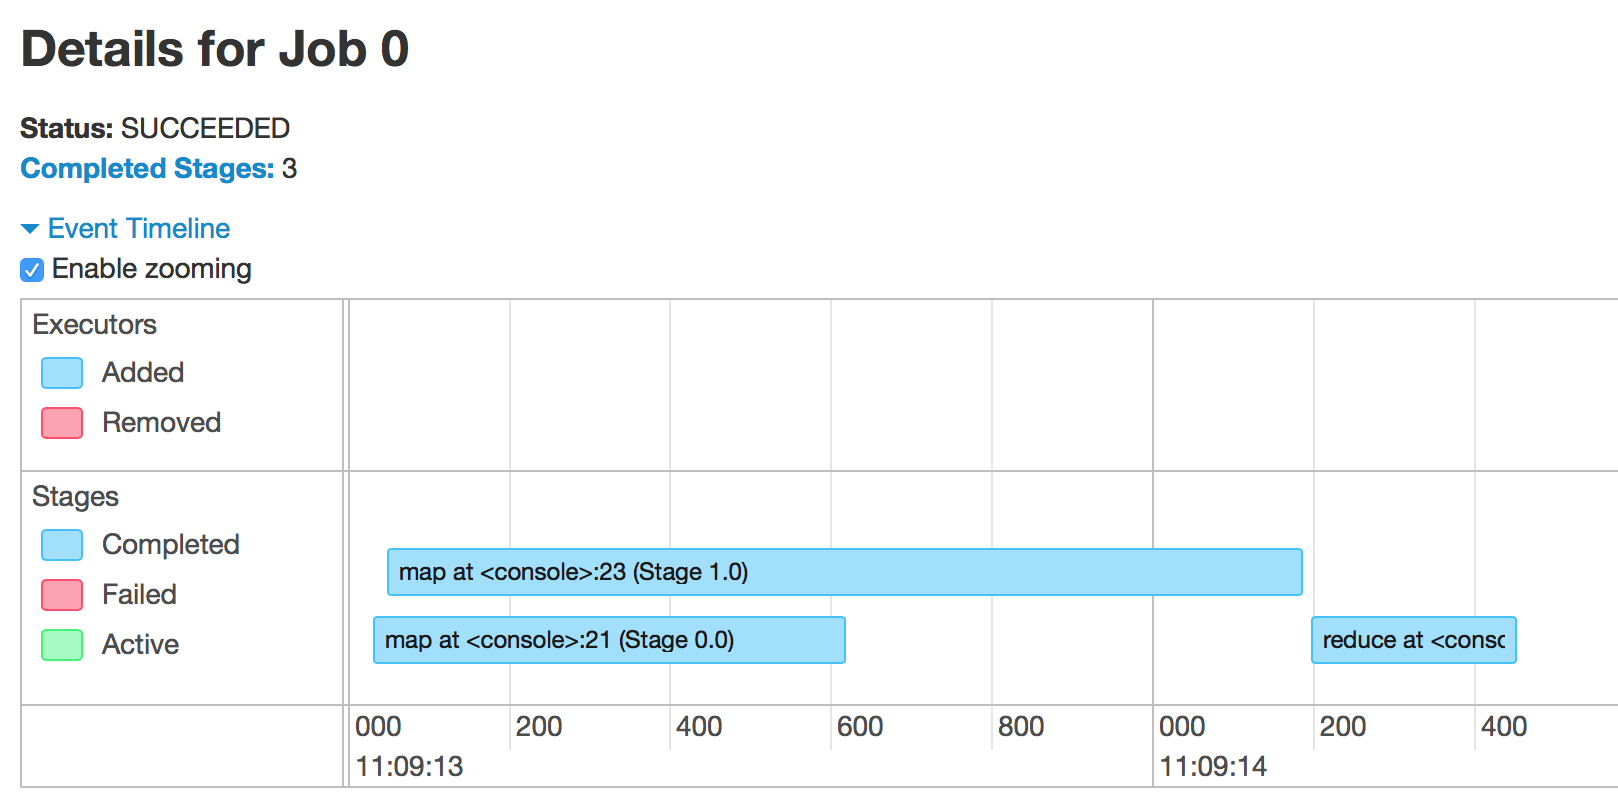
Using this visualisation gives you a great ‘at a glance’ sense of where parallelism is (or isn’t) occurring in your application.

Pingback: Using the Spark Event Timeline | Inside Documentum
Pingback: Digging into Spark Scheduler Delay | (Machine) Learning at Speed